
Ultrasound


Posterior Vitreous Detachment
DOI: https://doi.org/10.21980/J89K9NOcular ultrasound was performed and demonstrated a thin, slightly echogenic strand (blue arrow) extending from the posterior eye into the vitreous humor (yellow arrow) which was hyperkinetic with extraocular motion. These findings are consistent with a posterior vitreous detachment (PVD).
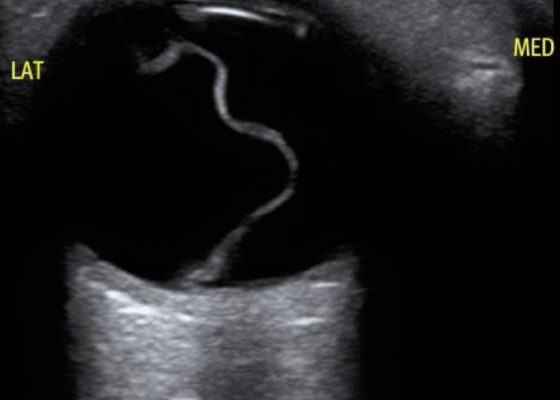
Macula-Off Retinal Detachment Identified on Bedside Ultrasound
DOI: https://doi.org/10.21980/J8WP8KPoint-of-care ultrasound was performed, demonstratinga free-floating, serpiginous, hyperechoic membrane (R) tethered at the optic nerve (ON) and ora serrata (OS), but detached at the macula (M) lateral to the optic nerve. This is diagnostic for macula-off retinal detachment. It can be differentiated from macula-on retinal detachment, in which the hyperechoic retina would appear attached posteriorly at the location of the macula just lateral to the optic nerve. Ophthalmology was consulted, agreed with the diagnosis of macula-off retinal detachment, and took the patient to the OR for laser photocoagulation.

Point-of-Care Ultrasound for the Diagnosis of Systolic Heart Failure
DOI: https://doi.org/10.21980/J8HD1RBedside ultrasound with the phased array probe was used to obtain a parasternal long axis view which demonstrated poor contractility and a severely decreased ejection fraction (EF). M-mode was placed over the anterior leaflet of the mitral valve to create a tracing depicting both the E-wave of early diastole (green arrow) and the A-wave from the atrial kick (blue arrow). The shortest distance between the septum and the mitral valve on the M-mode tracing gives the patient’s E-Point Septal Separation (EPSS) (pink arrow). EF can be estimated using the formula EF=75.5-2.5 x EPSS (in mm). This patient’s EPSS was measured to be 20mm which estimates that she had an EF of 25.5%.

Bedside Ultrasound for the Rapid Diagnosis of Fournier’s Gangrene
DOI: https://doi.org/10.21980/J8CP99Point of care ultrasound (POCUS) utilizing a high-frequency linear probe revealed heterogeneous debris with subcutaneous air within the scrotal wall extending into the perineum consistent with necrotizing fasciitis of the perineum or Fournier’s gangrene (FG). The video shows multiple foci of gas that appear as echogenic dots with “dirty shadows” posteriorly from reverberation artifact arising from gas within the soft tissue.
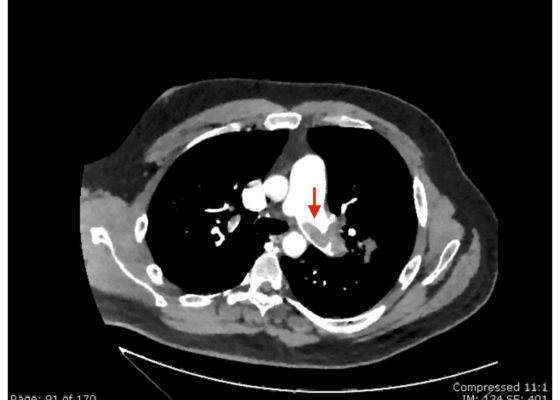
Saddle Pulmonary Embolus
DOI: https://doi.org/10.21980/J8N63PAn electrocardiogram (ECG) showed evidence of right heart strain with an incomplete right bundle branch block, S1Q3T3 (see red arrow [S1], blue arrow [Q3], and black arrow [T3]), and ST-segment elevation in the septal leads (green arrows). Bedside echocardiography showed a dilated right ventricle with ventricular wall akinesis (red arrow) sparing the apex (purple arrow), which is known as McConnell’s Sign. It also showed a mobile hyperechoic mass (yellow arrow). These ultrasound findings were concerning for pulmonary embolism (PE), so computed tomography (CT) angiogram of the chest was ordered and confirmed massive bilateral obstructive filling defects (red arrows) consistent with saddle pulmonary embolism. Additionally, noted is flattening of the interventricular septum (blue arrow) consistent with right heart strain. Laboratory studies were notable for a troponin-I of 0.29 ng/mL, a B-type natriuretic peptide of 792.3 pg/mL, lactic acid of 5.30 mmol/L, and a creatinine of 2.0 mg/dL, consistent with end organ dysfunction. All other lab work was within normal limits.
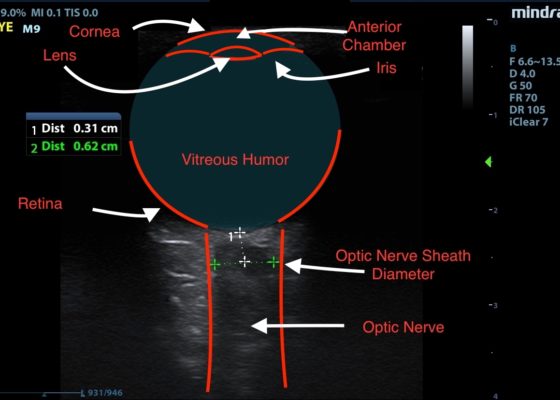
Idiopathic Intracranial Hypertension and Optic Nerve Sheath Diameter
DOI: https://doi.org/10.21980/J84631Optic nerve sheath diameter (ONSD) was measured via ultrasound with diameter 5.7mm on left and 6.2mm on right. In order to measure ONSD via optic ultrasound the high-frequency linear array probe (7.5-10-MHz or higher) is utilized in B-mode. The patient is positioned supine and an occlusive dressing, such as Tegaderm, is placed over a closed eyelid with copious conductive gel on top of the dressing. Being careful not to put pressure on the globe, an axial cross-sectional image of the globe is obtained. As demonstrated in the image “annotated left eye ONSD pre-lumbar puncture,” there are two main anechoic areas of the globe, the anterior chamber and the vitreous humor. These anechoic structures are separated by the hyperechoic iris, which surfaces the hyper-echoic-lined lens. At the back of the vitreous humor is the retina, which leads posteriorly into the optic nerve. The optic nerve is the hypoechoic structure posterior to the retina and surrounded by the hyperechoic subarachnoid space, which is encased by the hypoechoic dura mater. The outer edge of the hypoechoic dura matter is where the ONSD is measured.1 The user applies calipers to measure 3mm perpendicularly behind the retina along the hypoechoic optic nerve, and at this level the transverse dimensions of the ONSD are measured using calipers as shown in the images.Computed tomography (CT) of the head was performed and showed no abnormalities. Lumbar puncture was performed in left lateral decubitus position revealing elevated opening pressure of 29cm H2O. Thirty-five mL of clear cerebral spinal fluid was drained and was negative for all infectious studies. Optic nerve sheath diameter was again measured post-lumbar puncture with diameters 5.4mm on left and 5.4mm on right.
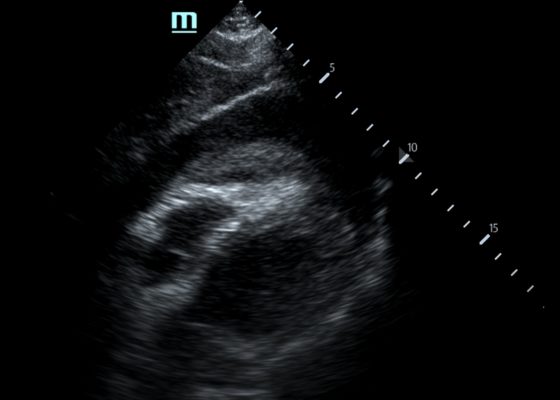
Pericardial Clot on Point-of-Care Ultrasound
DOI: https://doi.org/10.21980/J8ZH1TFocused assessment with sonography in trauma (FAST) scan was positive for a clinically significant pericardial effusion as evidenced by the hypoechoic fluid around the myocardium, indicated by the blue arrow in image 2. Findings are also consistent with tamponade process as evidenced by restricted expansion and collapse of the right ventricle during diastole. The hyperechoic floating structure between the pericardium and myocardium, adjacent to the right ventricle, represents a pericardial clot, indicated by the white arrow.The density of the pericardial clot differs from that of the myocardium, thus serving as an additional variable to avoid confusing this as part of the myocardial structure.

Arteriovenous Graft Pseudoaneurysm
DOI: https://doi.org/10.21980/J8B06ZA bedside ultrasound of the mass demonstrated a large compressible hypoechoic structure (see purple outline) above the arteriovenous graft (see red outline). The contents demonstrated movement of fluid within the structure. This was confirmed with Doppler mode, which allowed for visualization of flow communicating between the structure and the underlying vessel, which is diagnostic for a pseudoaneurysm.