Cardiology/Vascular
Spontaneous Coronary Artery Dissection Causing Cardiac Arrest in a Post-Partum Patient – A Case Report
DOI: https://doi.org/10.21980/J8F947A post-ROSC electrocardiogram revealed ST elevations in leads I, aVL, and V3-V6, with reciprocal ST depressions in leads II, III, and aVF. Initial troponin I level was 0.238 ng/mL and a bedside cardiac ultrasound revealed decreased motion of the anterior wall. Cardiology was consulted and the patient was immediately taken to the catheterization lab where she was found to have long and diffuse luminal narrowing of her distal left anterior descending artery (LAD) resulting in 70% stenosis, consistent with the angiographic appearance of an intramural hematoma caused by dissection (white arrows). No intervention was performed.
Case Report—Pediatric Brugada Phenotype from Accident Cocaine Ingestion
DOI: https://doi.org/10.21980/J8VH28Initial EKG was concerning for type I Brugada pattern with an incomplete right bundle branch block in V1 & ST segment elevation terminating in an inverted T wave in V2. There are also signs of sodium channel toxicity with a widened QRS complex, tachycardia and a terminal R wave present in aVR where the R wave is bigger than the S wave or the R wave is over 3mm in aVR.
Case Report: Thoracic Aortic Dissection in a Previously Healthy Male with an Unusual Inciting Factor
DOI: https://doi.org/10.21980/J8G92SA non-contrast computed tomography (CT) scan was negative for a suspected ureteral stone. However, there were aortic calcifications visualized at the infrarenal level that were notable given the patient’s age (red arrow). Given this finding in conjunction with the patient’s symptoms, bedside transabdominal ultrasonography was performed which revealed an intraluminal echogenic flap within the aorta near the common iliac arteries. CT angiography (CTA) with delayed contrast protocol revealed an extensive Stanford type A aortic dissection with involvement of the aortic root (purple arrow), brachiocephalic trunk, ostia of the left subclavian artery, descending aorta (blue arrow), bilateral common iliac arteries, and left internal iliac artery.
A Case Report of Cardiac Tamponade
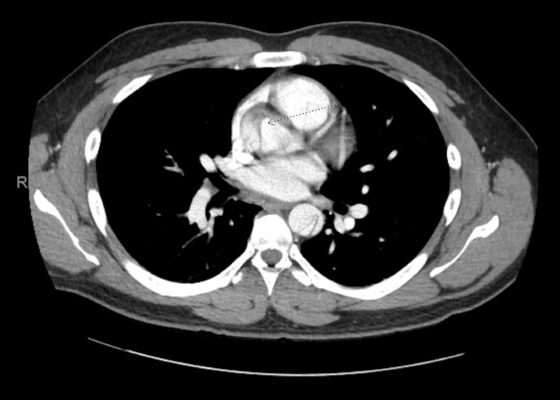
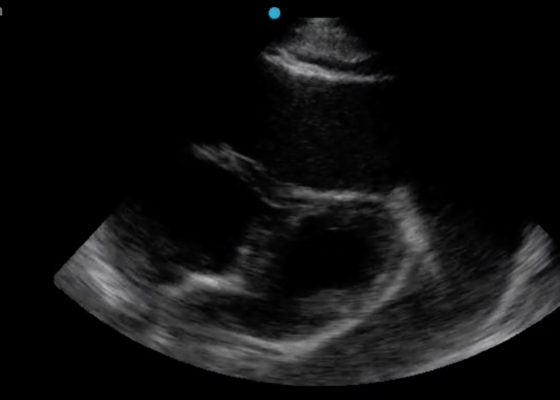
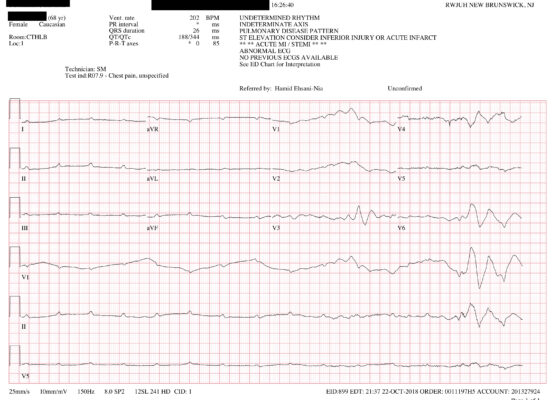
DOI: https://doi.org/10.21980/J8J644The patient was in noticeable respiratory distress and had oxygen saturation of 94% on room air. Bilateral jugular venous distention with severe right supraclavicular lymphadenopathy and diffuse bilateral wheezing was present. Although muffled heart sounds and hypotension are part of Beck’s Triad, these were not present in this case. Electrocardiogram obtained on arrival showed a sinus tachycardia with low-voltage QRS complexes and electrical alternans. Low voltage QRS can be seen on the ECG provided and is demonstrated by the low amplitude of the QRS complexes seen on all the leads. Electrical alternans may have an alternating axis or amplitudes of the QRS complex. Alternating axis is best visualized in V4-V6 on this ECG while alternating amplitudes are seen throughout the rest of the ECG. Computed tomography angiogram (CTA) of the chest revealed a large pericardial effusion with bilateral pulmonary emboli and a right upper lobe mass. A bedside transthoracic echocardiogram (TTE) was then performed and confirmed the large effusion, but also showed right ventricular collapse during diastole, indicative of cardiac tamponade.
A Case Report of a Transected Carotid Artery Caused by a Stab Wound to the Neck
DOI: https://doi.org/10.21980/J8BP8MThe post intubation chest x-ray (CXR) showed severe rightward displacement of the trachea (purple arrow). The computed tomography angiogram (CTA) showed transection of the left common carotid artery (LCCA), extensive neck hematoma without extravasation and severe tracheal deviation to the right (blue arrow). The intravenous (IV) contrasted chest computed tomography (CT) image showed a lateral contrast projection from the aortic arch at the level of the isthmus (green and pink arrows). There were no other significant injuries reported on the CT scans of the chest, abdomen and pelvis.
Extracorporeal Membrane Oxygenation (ECMO) for Refractory Cardiac Arrest
DOI: https://doi.org/10.21980/J88W69ABSTRACT: Audience: Our target audience includes emergency medicine residents/physicians. Introduction: Treating cardiac arrest is a common theme during simulated emergency medicine training; however, less time is focused on treating refractory cases of cardiac arrest. There are varying definitions of refractory cardiac arrest, but it is most commonly defined as the inability to obtain return of spontaneous circulation (ROSC) after 10-30
Cardiac Tamponade
DOI: https://doi.org/10.21980/J81D1DBy the end of this simulation session, the learner will be able to: (1) describe a diagnostic differential for dizziness (2) describe the pathophysiology of cardiac tamponade (3) describe the acute management of cardiac tamponade, including fluid bolus and pericardiocentesis (4) describe the electrocardiogram (ECG) findings of pericardial effusion (5) describe the ultrasound findings of cardiac tamponade (6) describe the indications for emergent bedside pericardiocentesis versus medical stabilization and delayed pericardiocentesis for cardiac tamponade (7) describe the procedural steps for pericardiocentesis, and (8) describe your state’s laws regarding disclosure for sentinel events.
Paroxysmal Ventricular Standstill—A Case Report of all Ps and no QRS in Ventricular Asystole
DOI: https://doi.org/10.21980/J8SS79In route, it was proposed that this patient was suffering from a dysrhythmia due to the transient episodes of syncope with lack of ventricular activity on telemetry. Upon close examination of the rhythm strips as well as the ECG, P waves can be visualized without any accompanying QRS complexes lasting multiple seconds (ED ECG blue arrows). Additionally, the rhythm has an intrinsic rate of 100 beats per minute and has a consistent morphology with no evidence of ventricular activity due to the lack of QRS complexes. As a result, the rhythm likely originates in the atria with no passage of impulses into the ventricles through the atrioventricular (AV) node versus an accelerated ventricular rhythm where QRS complexes would be seen.8 These rhythm strips demonstrate an example of VS. There is preserved native atrial automaticity, with an intact sinoatrial (SA) node, with a complete lack of ventricular electrical activity


