Visual EM
A Case of Otomastoiditis
DOI: https://doi.org/10.21980/J8RK89The patient underwent computed tomography (CT) of the head which revealed opacification of the left middle ear (red arrow) and mastoid air cells (red circles). Additionally, there was thickening of the soft tissues of the external auditory canal (blue arrowhead), likely reflecting concurrent otitis externa. Based on the imaging, he was admitted for findings consistent with acute otomastoiditis.
Osborn Waves in a Severely Hypothermic Patient
DOI: https://doi.org/10.21980/J8H34SThe initial EKG shows marked elevation of the J-point (point where the QRS segment joins the ST segment), otherwise known as an “Osborn Wave” (see black arrows). A subsequent EKG obtained after active rewarming, showed resolution of the Osborn waves.
Acromioclavicular joint separation
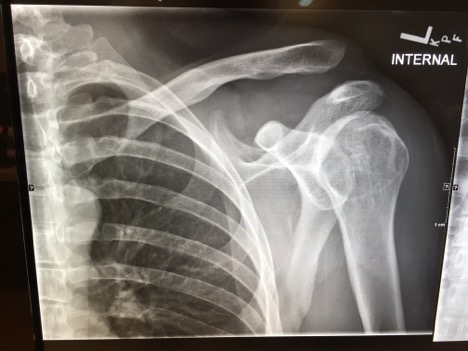
DOI: https://doi.org/10.21980/J8C91GHistory of present illness: A 30-year-old male was brought in by ambulance to the emergency department as a trauma activation after a motorcycle accident. The patient was the helmeted rider of a motorcycle traveling at an unknown speed when he lost control and was thrown off his vehicle. He denied loss of consciousness, nausea, or vomiting. The patient’s vital signs
Torsades de Pointes
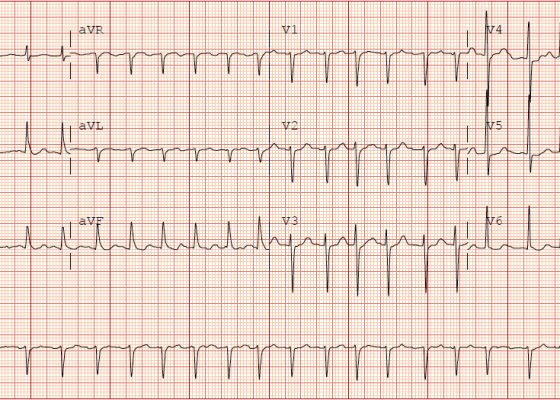
DOI: https://doi.org/10.21980/J87K91The patient was found to be in a polymorphic ventricular tachycardia; he was alert, awake and asymptomatic. A rhythm strip showed a wide complex tachycardia with the QRS complex varying in amplitude around the isoelectric line consistent with Torsades de Pointes.
Pediatric Pulmonary Abscess
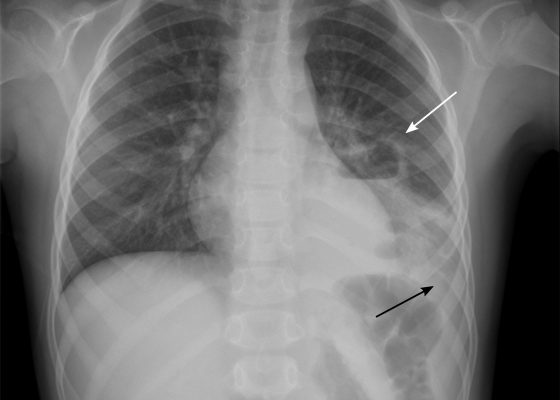
DOI: https://doi.org/10.21980/J83S6QUpright posterior-anterior plain chest films show a left lower lobe consolidation with an air-fluid level and a single septation consistent with a pulmonary abscess (white arrows). A small left pleural effusion was also present, seen as blunting of the left costophrenic angle and obscuration of the left hemidiaphragm (black arrows).
Scaphoid Fracture
DOI: https://doi.org/10.21980/J80344The anteroposterior (AP) plain film of this patient demonstrates a full thickness fracture through the middle third of the scaphoid (red arrow), with some apparent displacement (yellow lines) and subtle angulation of the fracture fragments (blue line).
Type 1 Brugada Syndrome
DOI: https://doi.org/10.21980/J8V91TECG shows an incomplete right bundle branch block (blue arrow) with coved ST segment elevation and an inverted T wave in V1 (red arrow) and ST segment elevation in V2 (black arrow).
Acute comminuted intertrochanteric hip fracture
DOI: https://doi.org/10.21980/J8QK9CHistory of present illness: A 69-year-old male presented to the emergency department (ED) with left hip pain after he was rear-ended on his bicycle by a vehicle traveling 10-15 miles per hour. He had normal vital signs. On exam, his left lower extremity was externally rotated and shortened with trochanteric point tenderness. His pelvis was stable. His lower extremity compartments


