ECG
A Case Report of Subtle EKG Abnormalities in Acute Coronary Syndromes Indicative of Type One Myocardial Infarction
DOI: https://doi.org/10.21980/J8W06XThe ECG does show multiple subtle abnormalities that in conjunction with his symptoms and risk factors are concerning for ischemia and/or occlusion of the coronary artery vessel. 1) ST depression in aVL. Although slight, the ST segment is below the TP segment or isoelectric point (blue circles). 2) Focal hyper QT waves. The T-waves in II, III, AVF V2, V3, and V4 are hyper acute, namely peaked and tall in relationship to the QRS. These are best displayed in leads II, III, and AVF where the T-waves are taller than the QRS amplitude (vertical blue lines). 3) Straightening off the ST segment. Multiple leads display a straight ST segment namely aVL, III, AVF, and V2 (red lines). Of note, the length of the straight ST segment is greater than 1/4 the amplitude of the QRS (purple lines). 4) Although subtle, these abnormalities are focal in nature.
Electrocardiogram Abnormalities Following Diphenhydramine Ingestion: A Case Report
DOI: https://doi.org/10.21980/J85H1PThe blue arrow points to one of the terminal R waves in aVR, and the green arrow points to one of the large S waves in lead I, indicating right axis deviation. These findings are pathognomonic for sodium channel blockade. Due to the specific ECG findings and knowledge of diphenhydramine overdose, it was evident that these ECG findings were due to a cardiac sodium channel blockade. Sodium channels are essential within myocardial tissue to ensure the rapid upstroke of cardiac action potential, as well as rapid impulse conduction throughout cardiac tissue. Therefore, sodium channel blockers tend to exhibit significant dysrhythmic properties due to severe conduction disturbances.2 The blockage of the cardiac sodium channels appears as terminal R waves in aVR as well as terminal S waves in lead I due to delaying, and possibly blocking, the electrical conduction pathway of the heart. The orange arrows show resolution of terminal R wave in aVR and terminal S wave in lead I, after administration of sodium bicarbonate.
Inferior STEMI Electrocardiogram in a Young Postpartum Female with Sickle Cell Trait with Chest Pain – A Case Report
DOI: https://doi.org/10.21980/J8KP95ECG shows evidence of ST segment elevation in the inferolateral leads with reciprocal change in a bigeminy pattern. The ECG pattern seen in this patient demonstrates ST elevations in the inferior leads (II, III, and avF) as well as the precordial leads V4-V6. Reciprocal changes can also be seen in leads I and avL. Though this STEMI pattern is typically associated with occlusion of the right coronary artery in 80% of cases, it may also be caused by occlusion of the left circumflex artery. This may explain this patient’s cardiac catheterization findings of vasospasm in the left circumflex coronary artery.
‘Cath’ It Before It’s Too Late: A Case Report of ECG Abnormalities Indicative of Acute Pathology Requiring Immediate Catheterization
DOI: https://doi.org/10.21980/J8HW7VA 12 lead ECG performed at the time of emergency department (ED) admission revealed regular sinus rhythm with noted T-wave inversion (blue arrows on Figure 1) in Lead aVL new when compared to an ECG performed a few months prior (see Figure 3). Two days later a second ECG was done when the patient developed acute chest pain while in the ICU (Figure 2) that showed persistent inversion in Lead aVL (blue arrows) as well as new J point deviation (JPD) in Leads II, aVF, V5 and V6; and new JPD in Leads V1 and V2 (green arrows) from her previous ECG while in the emergency department. These focal repolarization abnormalities did not qualify as an ST-elevation myocardial infarction by current guidelines.
Case Report—Pediatric Brugada Phenotype from Accident Cocaine Ingestion
DOI: https://doi.org/10.21980/J8VH28Initial EKG was concerning for type I Brugada pattern with an incomplete right bundle branch block in V1 & ST segment elevation terminating in an inverted T wave in V2. There are also signs of sodium channel toxicity with a widened QRS complex, tachycardia and a terminal R wave present in aVR where the R wave is bigger than the S wave or the R wave is over 3mm in aVR.
A Case Report of Cardiac Tamponade
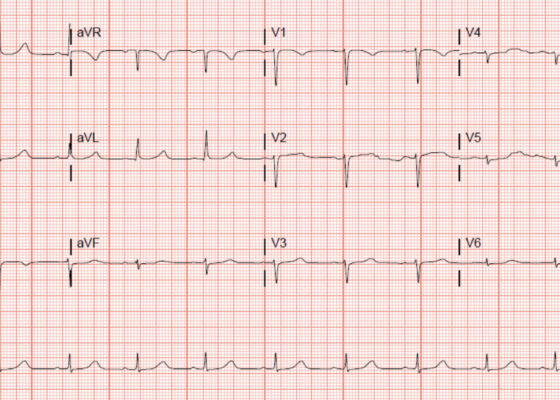
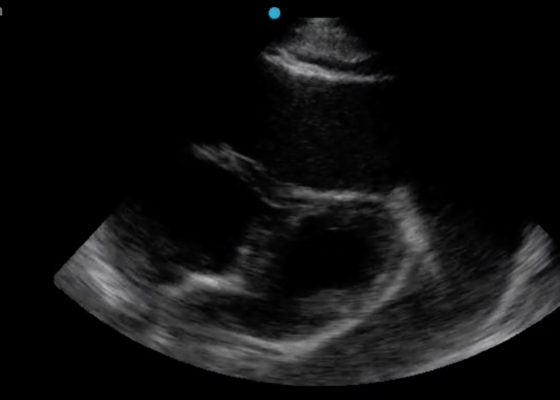
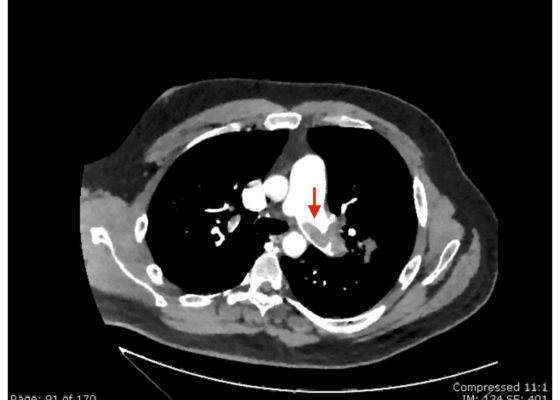
DOI: https://doi.org/10.21980/J8J644The patient was in noticeable respiratory distress and had oxygen saturation of 94% on room air. Bilateral jugular venous distention with severe right supraclavicular lymphadenopathy and diffuse bilateral wheezing was present. Although muffled heart sounds and hypotension are part of Beck’s Triad, these were not present in this case. Electrocardiogram obtained on arrival showed a sinus tachycardia with low-voltage QRS complexes and electrical alternans. Low voltage QRS can be seen on the ECG provided and is demonstrated by the low amplitude of the QRS complexes seen on all the leads. Electrical alternans may have an alternating axis or amplitudes of the QRS complex. Alternating axis is best visualized in V4-V6 on this ECG while alternating amplitudes are seen throughout the rest of the ECG. Computed tomography angiogram (CTA) of the chest revealed a large pericardial effusion with bilateral pulmonary emboli and a right upper lobe mass. A bedside transthoracic echocardiogram (TTE) was then performed and confirmed the large effusion, but also showed right ventricular collapse during diastole, indicative of cardiac tamponade.
Paroxysmal Ventricular Standstill—A Case Report of all Ps and no QRS in Ventricular Asystole
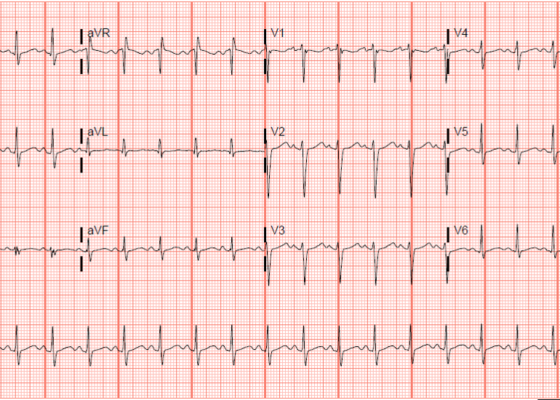
DOI: https://doi.org/10.21980/J8SS79In route, it was proposed that this patient was suffering from a dysrhythmia due to the transient episodes of syncope with lack of ventricular activity on telemetry. Upon close examination of the rhythm strips as well as the ECG, P waves can be visualized without any accompanying QRS complexes lasting multiple seconds (ED ECG blue arrows). Additionally, the rhythm has an intrinsic rate of 100 beats per minute and has a consistent morphology with no evidence of ventricular activity due to the lack of QRS complexes. As a result, the rhythm likely originates in the atria with no passage of impulses into the ventricles through the atrioventricular (AV) node versus an accelerated ventricular rhythm where QRS complexes would be seen.8 These rhythm strips demonstrate an example of VS. There is preserved native atrial automaticity, with an intact sinoatrial (SA) node, with a complete lack of ventricular electrical activity
Severe Hyperkalemia
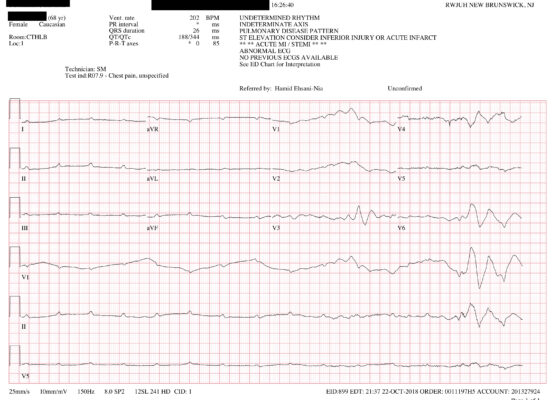
DOI: https://doi.org/10.21980/J8KH1DThe initial ECG obtained upon arrival shows what is commonly referred to as a sine wave pattern. This patient does have a biventricular pacemaker which would ordinarily create a wide QRS complex mimicking an intraventricular conduction delay. However, the QRS complex here is exceptionally wide, in excess of 400 milliseconds (normal: less than 120 milliseconds). As the QRS widens, alongside other deflections present on the ECG, it morphologically mimics a mathematical sine wave.
Post-Coital Sudden Cardiac Arrest Due to Non-Traumatic Subarachnoid Hemorrhage—A Case Report
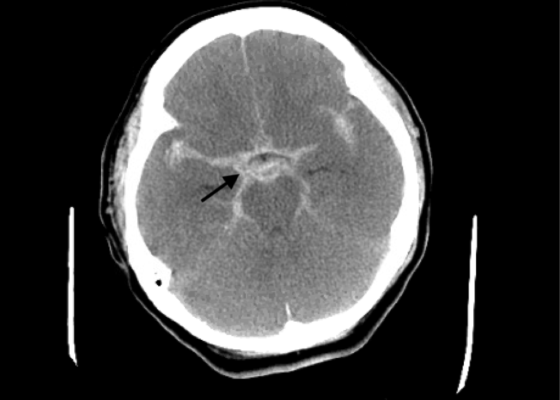
DOI: https://doi.org/10.21980/J8663NThe electrocardiogram demonstrated sinus tachycardia with ST segment elevation in lead aVR (black arrows) and diffuse ST depressions concerning for possible ST elevation myocardial infarction (STEMI). Given the events reported and the patient’s neurologic exam without sedation, non-contrast CT of the head was ordered; imaging showed evidence of a large subarachnoid hemorrhage, mostly at the level of the Circle of Willis (black arrow) concerning for an aneurysmal bleed as well as mild generalized white matter density suggestive of cerebral edema.
Saddle Pulmonary Embolus
DOI: https://doi.org/10.21980/J8N63PAn electrocardiogram (ECG) showed evidence of right heart strain with an incomplete right bundle branch block, S1Q3T3 (see red arrow [S1], blue arrow [Q3], and black arrow [T3]), and ST-segment elevation in the septal leads (green arrows). Bedside echocardiography showed a dilated right ventricle with ventricular wall akinesis (red arrow) sparing the apex (purple arrow), which is known as McConnell’s Sign. It also showed a mobile hyperechoic mass (yellow arrow). These ultrasound findings were concerning for pulmonary embolism (PE), so computed tomography (CT) angiogram of the chest was ordered and confirmed massive bilateral obstructive filling defects (red arrows) consistent with saddle pulmonary embolism. Additionally, noted is flattening of the interventricular septum (blue arrow) consistent with right heart strain. Laboratory studies were notable for a troponin-I of 0.29 ng/mL, a B-type natriuretic peptide of 792.3 pg/mL, lactic acid of 5.30 mmol/L, and a creatinine of 2.0 mg/dL, consistent with end organ dysfunction. All other lab work was within normal limits.


