
ECG


Propafenone Overdose-induced Arrhythmia and Subsequent Correction After Administration of Sodium Bicarbonate
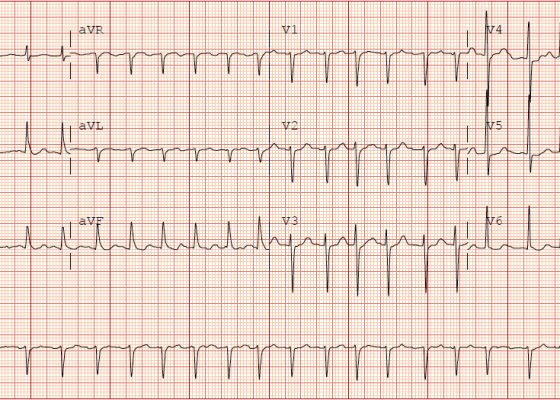
DOI: https://doi.org/10.21980/J8D925The first ECG in this case showed sinus tachycardia with a widened QRS (black arrow), a rightward axis, prolonged corrected QT interval (QTc), and terminal R wave in AVR (white arrow). There are several potential causes for these ECG findings, but put together with the patient’s history, we were suspicious of sodium channel blockers being the most likely cause. The second ECG, after sodium bicarbonate was administered, demonstrated a normal QRS (black arrow) and no rightward axis deviation, reduction of the QTC and resolution of the terminal R wave (white arrow). We later learned that the patient’s cardiologist recently increased her propafenone dose.
Osborn Waves in a Severely Hypothermic Patient
DOI: https://doi.org/10.21980/J8H34SThe initial EKG shows marked elevation of the J-point (point where the QRS segment joins the ST segment), otherwise known as an “Osborn Wave” (see black arrows). A subsequent EKG obtained after active rewarming, showed resolution of the Osborn waves.

Torsades de Pointes
DOI: https://doi.org/10.21980/J87K91The patient was found to be in a polymorphic ventricular tachycardia; he was alert, awake and asymptomatic. A rhythm strip showed a wide complex tachycardia with the QRS complex varying in amplitude around the isoelectric line consistent with Torsades de Pointes.

Type 1 Brugada Syndrome
DOI: https://doi.org/10.21980/J8V91TECG shows an incomplete right bundle branch block (blue arrow) with coved ST segment elevation and an inverted T wave in V1 (red arrow) and ST segment elevation in V2 (black arrow).

Osborn Waves
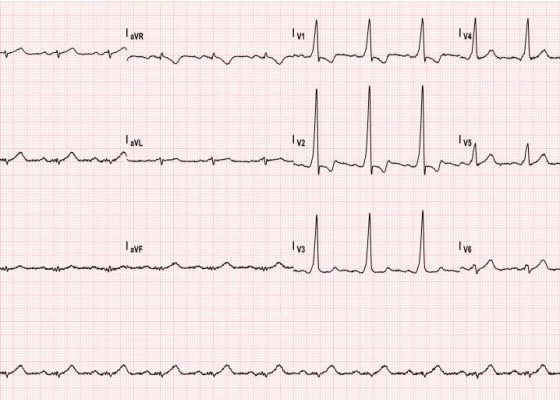
DOI: https://doi.org/10.21980/J8G34GThe initial ECG shows a junctional rhythm with Osborn waves (or J point elevations/J waves) in the lateral precordial leads, as well as the limb leads (Image 1). The second ECG, 49 minutes later, shows an improving ventricular rate and Osborn wave height decrease of approximately 50% (Image 2).
Asymptomatic Wolff-Parkinson-White Syndrome: Incidental EKG
DOI: https://doi.org/10.21980/J8T05XThe ECG shows slurred up-stroking of the QRS complexes characteristic of a delta wave. The PR interval is normal; however, the QT interval is greater than 110ms.
Hyperkalemia on ECG
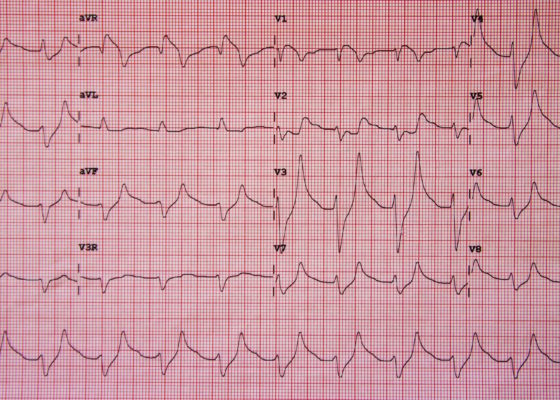
DOI: https://doi.org/10.21980/J8K017Initial ECG shows tall, peaked T waves, most prominently in V3 and V4, as well as QRS widening. These findings are consistent with hyperkalemia, which was promptly treated. Follow-up ECG post-treatment shows narrowing of the QRS complexes and normalization of peaked T waves.

Wolff-Parkinson-White Syndrome: Electrocardiogram
DOI: https://doi.org/10.21980/J8201KThe initial EKG showed wide complex, irregular tachycardia > 200 bpm (EKG 1). Given the possibility of Wolff-Parkinson-White (WPW), procainamide was given to the patient. The patient’s heart rate responded and decreased to 120-140 bpm with narrowing of the QRS complex. A repeat EKG showed narrow complex tachycardia without P waves approximately 120 bpm (EKG 2). Once the procainamide infusion was complete, the patient had converted to sinus rhythm with a delta wave now apparent, consistent with WPW (EKG 3).